
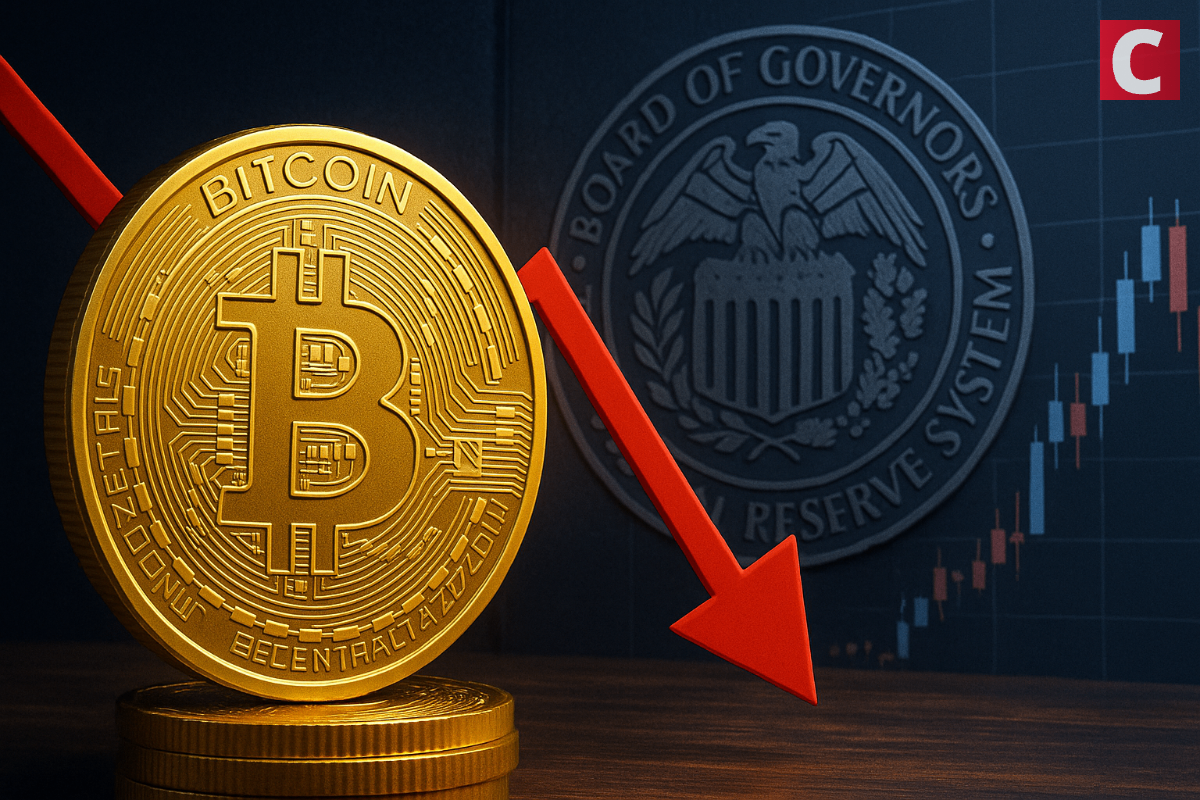
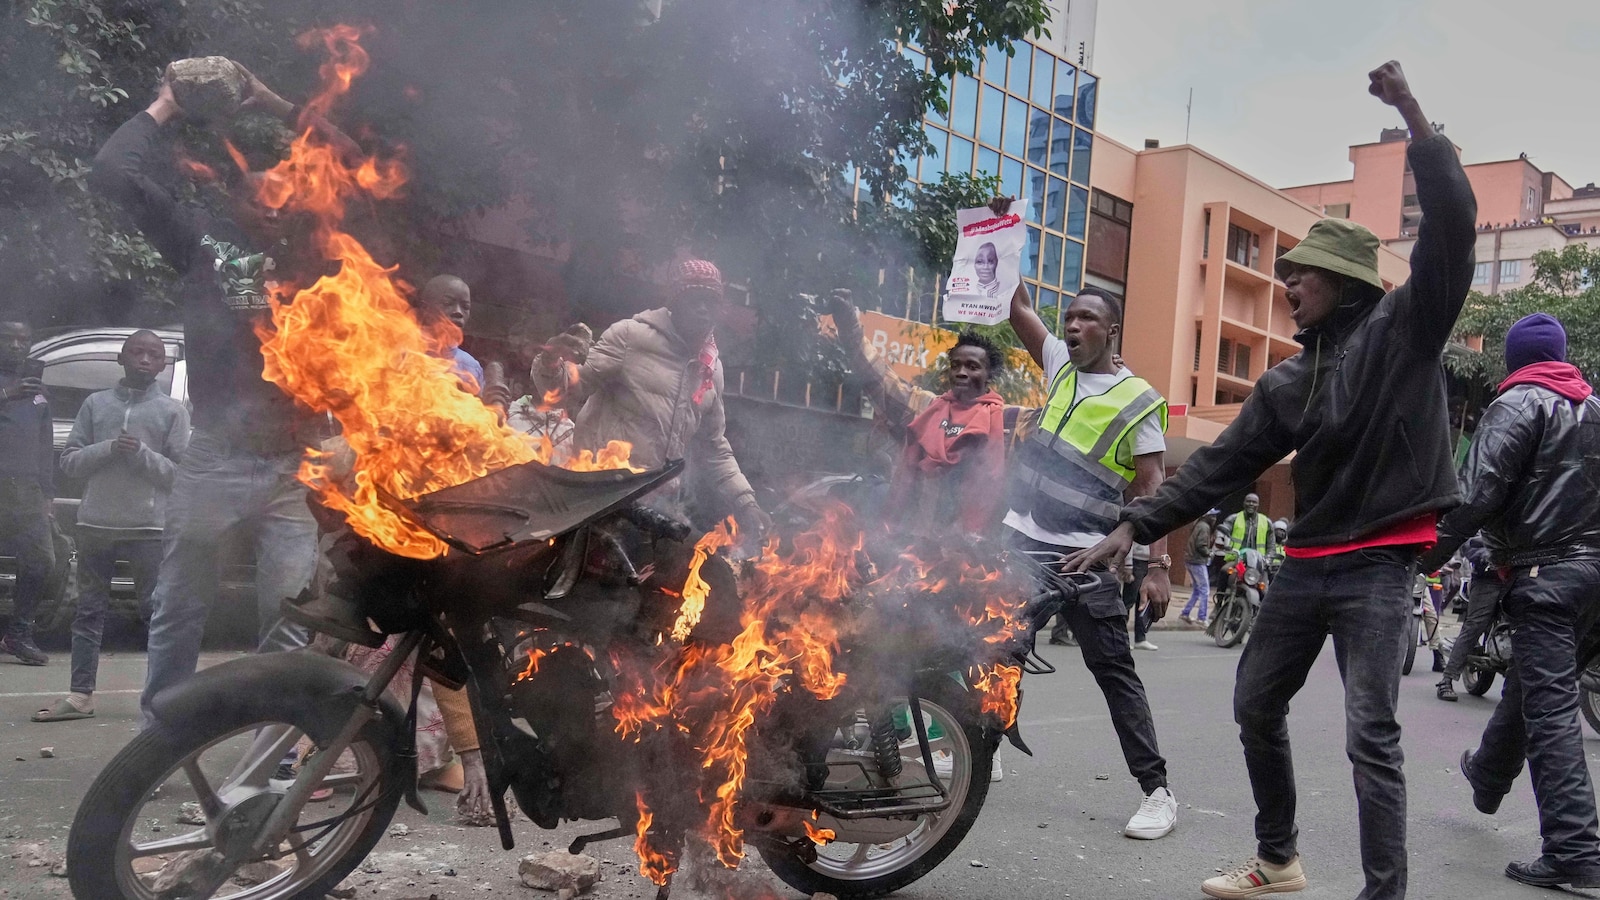
Ethereum price slows down in the midst of political conflict escalating in the East. Will price remain bullish and is technical analysis something to be considered at times of global instability? Join us in exploring what the latest price action provides as information to traders and what are key areas to look at over the next days/weeks.
Last week saw 195.32K $ETH flow into US Spot #ETH ETFs – the third-largest weekly net inflow on record. pic.twitter.com/MtTCPqWH8G
— glassnode (@glassnode) June 16, 2025
Even though there is global instability, interest in Ethereum’s ETF remains, as last week saw roughly $500 million inflows. That is a good sign for continued demand, though it might take a while before we see it reflected in the price.
DISCOVER: 9+ Best High-Risk, High-Reward Crypto to Buy in June 2025
Ethereum Price: Does TA Work During Global Instability?

(ETHUSD)
Let’s begin with a higher timeframe – the Weekly. Wild chart to be honest! A 100% increase in Ethereum price within 2 months. Just a month followed by a long crab walk. Market structure could be considered broken, though some analysts would want cleaner price action to make such a claim.
For example, the previous high that was tested last week. We are still below MA50 and MA100, though above MA200! And we have 5 doji candles! Doji’s usually mean market uncertainty. The next area I’ll be watching is the weekly FGV.
DISCOVER: 20+ Next Crypto to Explode in 2025

(ETHUSD)
The next timeframe to focus on is the Daily. The MSB here is a bit more believable. We also have prices that deviate above MA200 for a bit and drop below, followed by a retest and rejection. The deviation also looks a bit like the evening star candlestick pattern. Not great, but expected, after such a strong pump. RSI shows a bearish deviation at the moment.
There is also a daily FVG that fits MA100. Will price fill the weekly FVG and front-run the daily? I’d say TA does work for now.
DISCOVER: Best New Cryptocurrencies to Invest in 2025

(ETHUSD)
In conclusion, let us dive into a shorter 4H timeframe. There is a lot of confluence on the higher time frames, pointing toward a retrace. It is to be seen how deep it will go, though my preference is somewhere in the Daily FVG zone. Then the structure will look more efficient and the market can peacefully, hopefully accompanied by a peace agreement in the East, move above those MAs.
In the 4H timeframe, the price exceeded all MAs, which is another sign of weakness. One can always be surprised, though! Therefore, always manage your risk.
Join The 99Bitcoins News Discord Here For The Latest Market Update
Ethereum Price Stalls: Technical Analysis During Political Conflict?
-
Market structure remains bullish -
RSI shows hidden bearish divergence on 1D timeframe -
Price rejected by MA200 on 1D – current resistance -
Needs to break and close above MA200 on 1D for alt season.
Why you can trust 99Bitcoins
Established in 2013, 99Bitcoin’s team members have been crypto experts since Bitcoin’s Early days.
90hr+
Weekly Research
100k+
Monthly readers
50+
Expert contributors
2000+
Crypto Projects Reviewed


Follow 99Bitcoins on your Google News Feed
Get the latest updates, trends, and insights delivered straight to your fingertips. Subscribe now!
Subscribe now ![]()
![]()

ethereum-price-stalls-technical-analysis-during-political-conflict


Leave a Reply